
AI Agent
Data Analyst Agent
Turns your raw business data into clear, actionable insights without any manual work.
What is this?
Understanding Data Analyst Agent
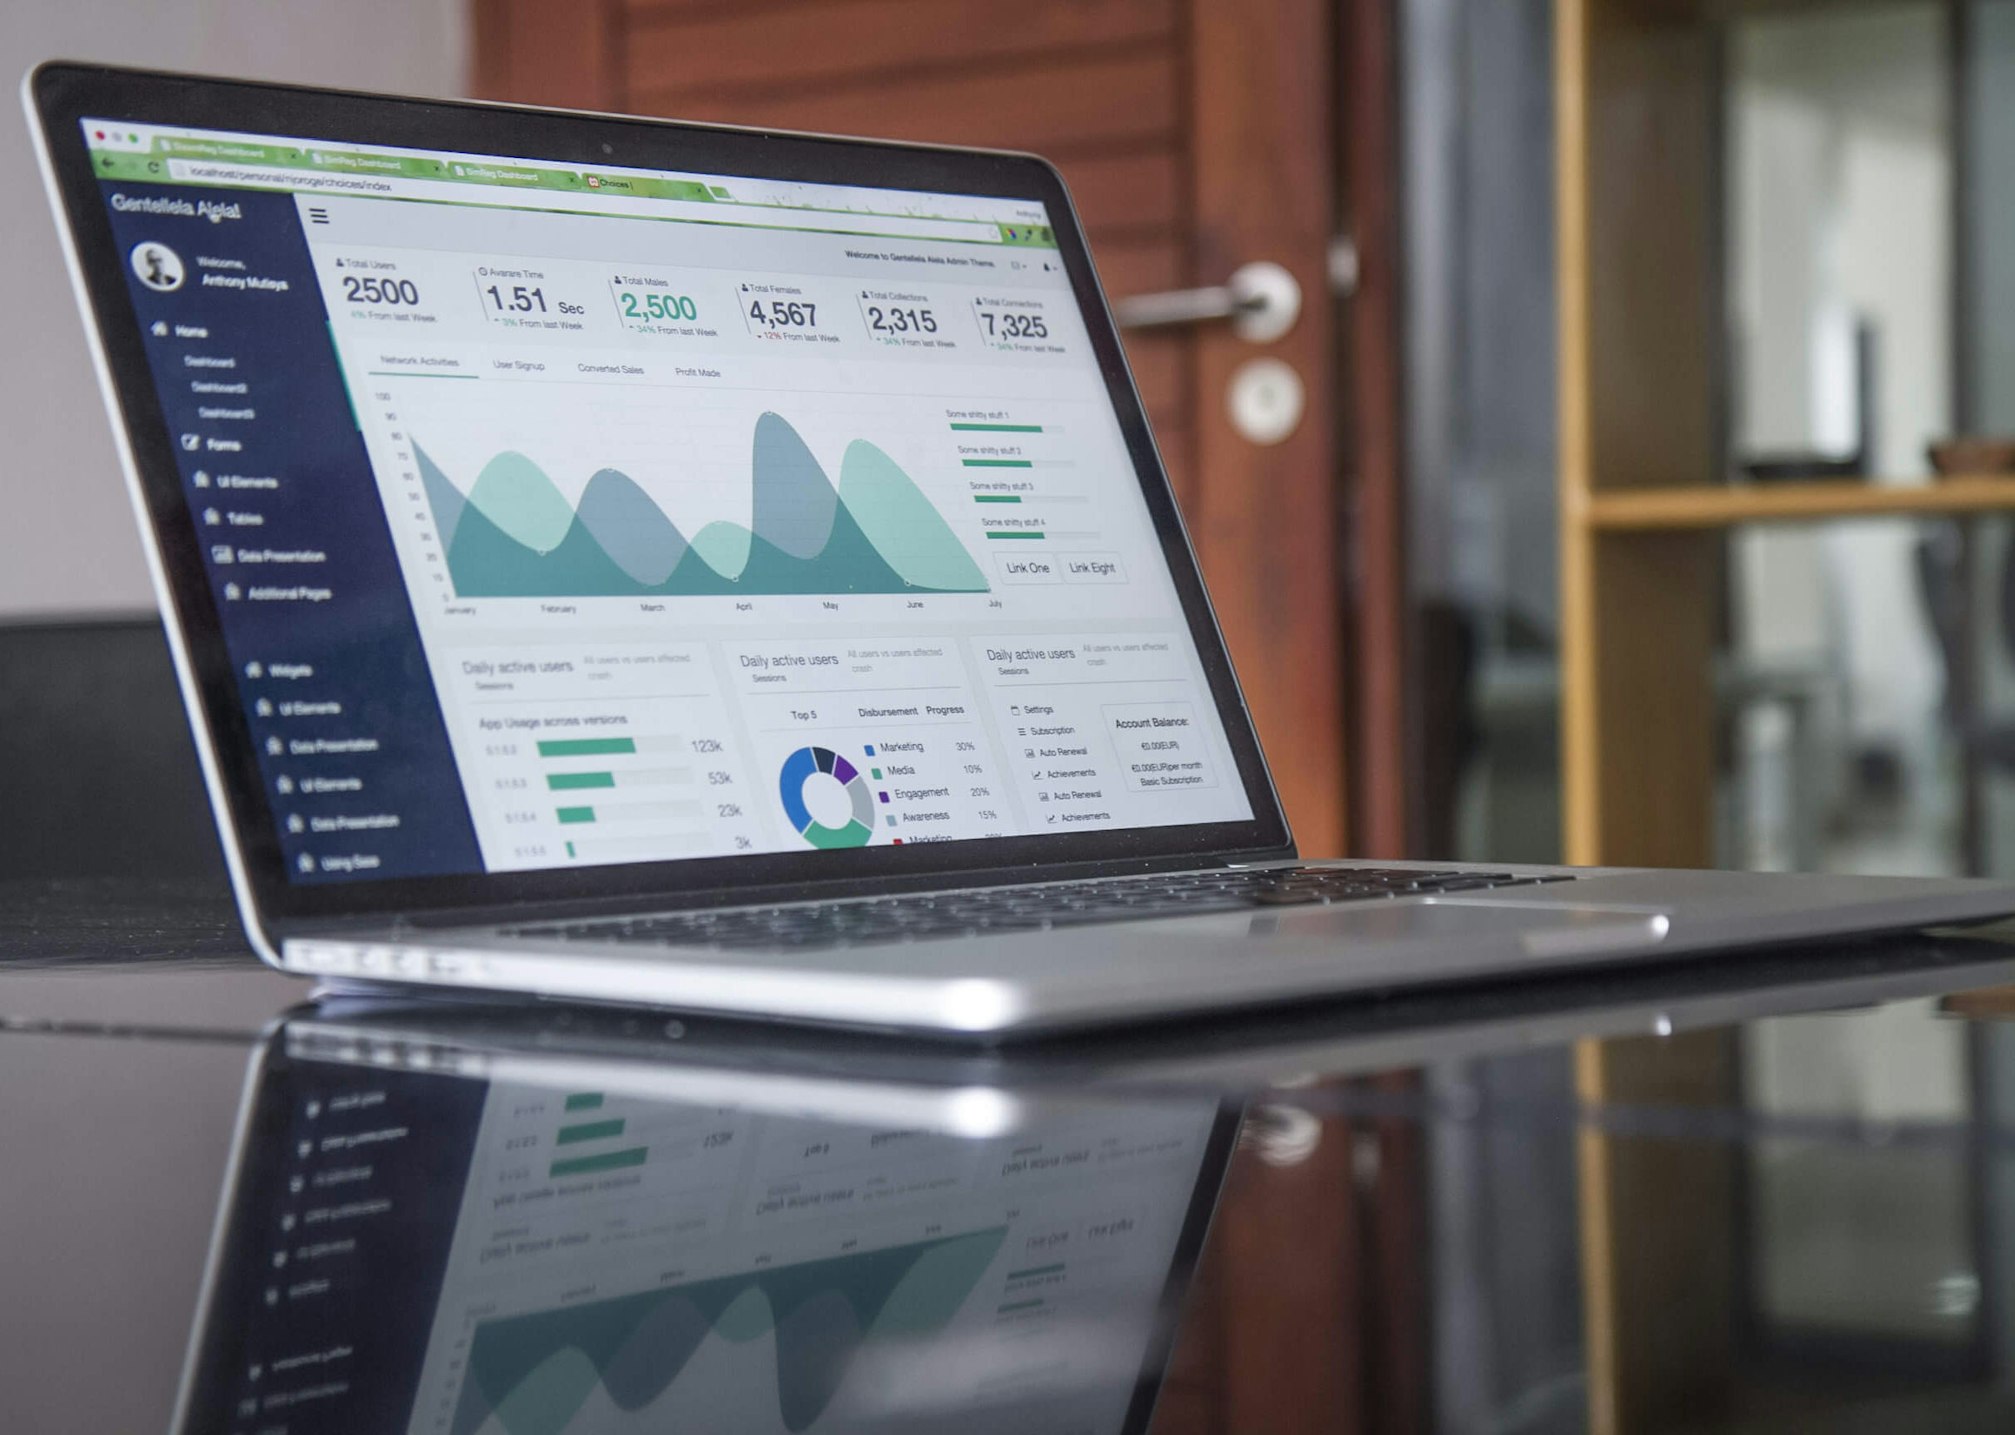
Most businesses have more data than they can use. It sits in databases, spreadsheets, and BI tools, largely unread, because turning raw data into useful insights requires someone to write queries, run analysis, build charts, and write a summary — and that takes time nobody has. A Data Analyst Agent does this automatically. It connects to your databases and data sources, runs queries on the schedule you set, performs trend analysis, generates dashboards, writes plain-language summaries of the key findings, and alerts your team when something important changes.
Core Capabilities
Our Process
How We Deploy It
Data Source Audit
We map all your data sources — databases, spreadsheets, BI tools, third-party APIs — and assess data quality and completeness.
Connect and Configure
We connect the agent to your data sources with read-only access and configure the queries and KPIs you want it to track.
Design Report Templates
We build report templates that match your business — the metrics that matter to you, in the format that is most useful.
Set Alerts and Schedules
We configure automated reports on your schedule and set up alert thresholds so the agent notifies you when important metrics change.
Real Examples
What This Looks Like in Practice
Every morning at 7am, the agent queries the production database, calculates the previous day's revenue by region, compares it to the same day last week and last month, and posts a structured summary to the leadership Slack channel.
The agent detects that customer churn rate has increased by 1.8 percentage points compared to last month and immediately sends an alert to the customer success team with a breakdown by customer segment.
Before a board meeting, the CEO asks the agent for a revenue analysis by product line for the last 6 quarters. The agent runs the analysis, generates charts, and delivers a formatted slide deck in under 10 minutes.
How It Works Technically
Agent Architecture
Data Sources
PostgreSQL / Snowflake / Sheets
Query Engine
Scheduled SQL and Python
LLM Analysis
Trends, anomalies, summaries
Chart Generation
Matplotlib / Metabase
Report Delivery
Slack / Email / Dashboard
Technology Stack
Real Impact
Case Study
Context
A retail chain with 14 stores and an e-commerce operation generating data across 3 different systems.
The Problem
The management team had no consolidated view of business performance. Monthly reports were prepared manually by a finance analyst and took 3 days to compile. By the time decisions were made, the data was already 4 weeks old.
What We Built
The Data Analyst Agent now produces a daily performance summary across all 14 stores and the e-commerce operation. Weekly reports are generated automatically every Friday. The team makes decisions based on data that is less than 24 hours old.
3 days → 0
Report Preparation Time
Real-time
Data Freshness
12/week
Analyst Hours Saved
See It Live
Interactive Demo
Watch a real step-by-step simulation of this agent completing an actual business task from start to finish.
More Agents
Other AI Agents We Build
Sales Outreach Agent
Handles the top of your sales funnel without needing a human to manage it.
Customer Support Agent
Resolves support tickets around the clock without any human involvement.
Research and Intelligence Agent
Keeps an eye on your market and brings you structured insights on a regular schedule.
Operations Agent
Keeps your internal workflows moving without anyone micromanaging them.
Get Started
Want this agent working in your business?
Book a free audit and we will show you exactly how we would deploy this for your specific workflows.